

BUSINESS INSIGHTS
See what's happening across your entire commerce operation.
Turn sales, inventory, orders, warehouses and channel activity into reporting views that help you understand performance.
Built for your everyday inventory operation
 TijaraQBusiness overviewSample view
 Illustrative sales trend fluctuates while rising from January to June; no customer results are shown.
One business, useful answers
Look beyond the headline number.
The sales summary, stock report, movement ledger and profit and loss view answer different questions. Choose the view that fits the decision in front of you.
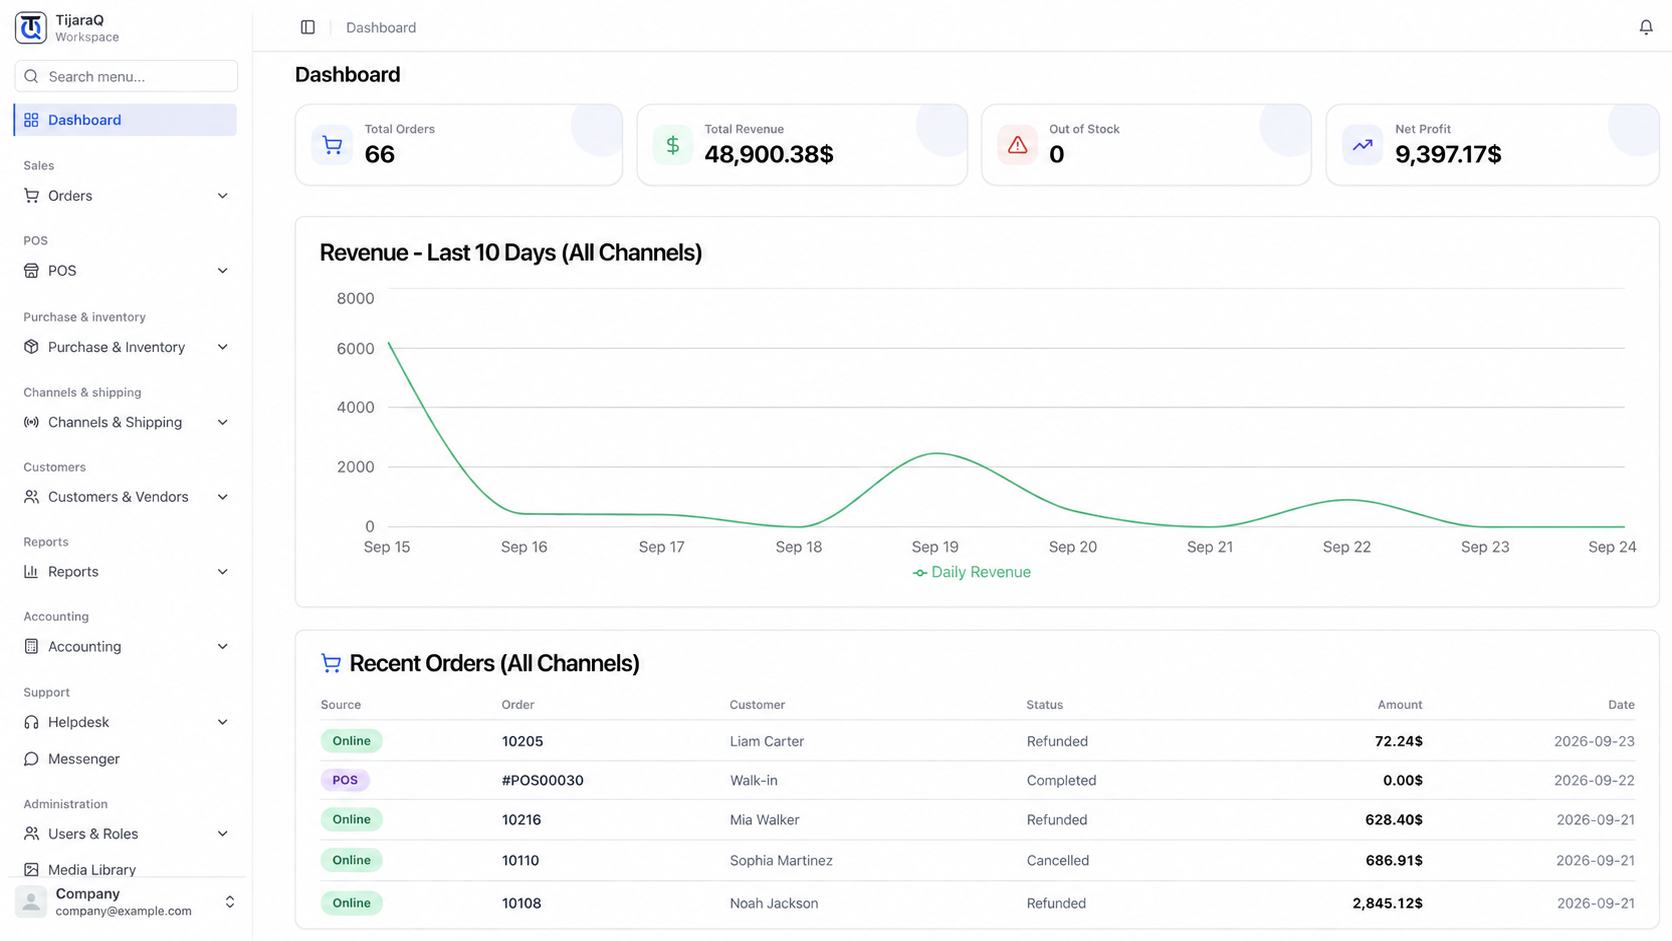
Real TijaraQ dashboard
Start with a shared operating view.
The dashboard connects order and stock signals at a glance. Open a focused report when you need the detail behind a number.
Explore Reports
Choose the report for the question.
Compare sales trends, order volume and channel activity across periods.
02 InventoryReview stock position and movement across TijaraQ locations.
03 OrdersAnalyze order volume, source and trends across connected commerce.
04 ProfitReview revenue, COGS, expenses and profit in TijaraQ reports.
05 ChannelsCompare order and sales activity across connected channels.
06 WarehousesCompare stock and movement across TijaraQ warehouses.
Keep the context
From analysis back to action.
A report answers a question; the connected operation gives your team a place to act on the answer.
TijaraQ
Make decisions with the full business picture.
See sales, stock and profit with the context behind each result.